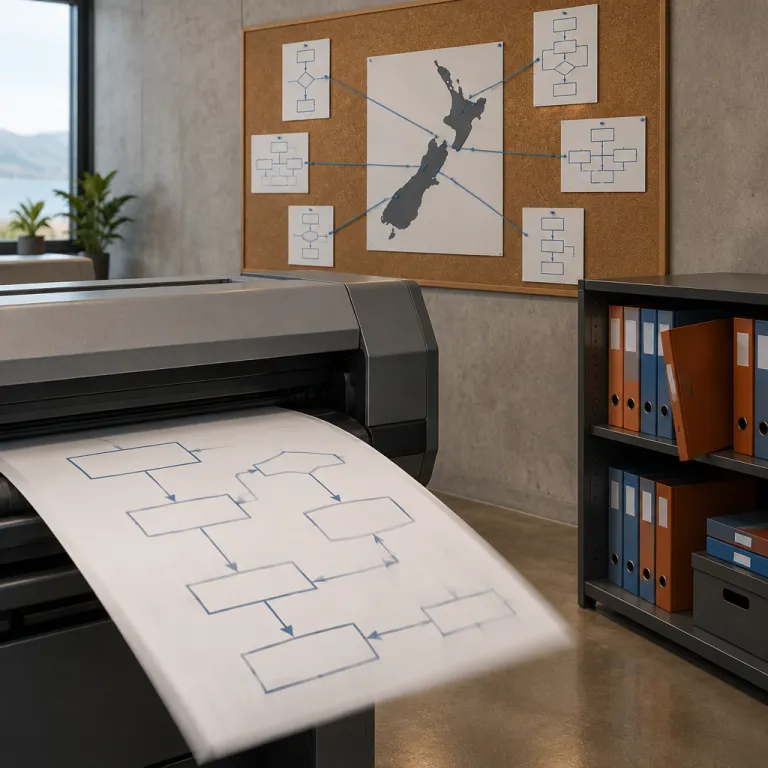
Why New Zealand office managers are turning to online flowchart makers
Office managers across New Zealand increasingly rely on an online flowchart maker to bring order to complex workflows. When you map each flow as a clear flowchart or swimlane diagram, you reduce ambiguity for every team and cut back on repetitive clarification emails. A modern flowchart maker lets you create, edit and share diagrams in real time, which is critical when your staff are split between Auckland, Wellington and remote home offices.
In many New Zealand companies, the first practical step is to create a simple process flow for core activities such as onboarding, purchase approvals or incident reporting. You can start from a free start template or a more advanced flowchart template, then adapt the steps to match your local compliance rules and internal board approvals. Because each template is reusable, you quickly build a library of flowchart templates that standardise how different teams learn and follow the same process.
Visual tools also help you turn ideas into action when projects move quickly. A good online flowchart maker usually includes mind maps and organisational chart options, so you can explore structures before locking in reporting lines or project squads. When you combine these diagrams with clear flowchart symbols and accurate data flow mapping, you create a single visual source of truth that supports better collaboration between operations, finance and HR.
Designing clear processes for hybrid and flexible New Zealand offices
Hybrid work has made it harder for office managers to keep everyone aligned on process steps. An online flowchart maker solves part of this challenge by giving every team member access to the same flowchart, diagram and process flow regardless of where they work. Because most tools are free or low cost at entry level, you can test a free flowchart workspace with one team before scaling it across the wider organisation.
When you design a new workflow, begin with a start template that reflects your sector, such as property management, professional services or technology. From there, you create and edit diagrams that show each decision point, required approval and data flow between systems like your CRM, payroll and visitor management platforms. Many New Zealand office managers now pair these visual collaboration boards with an enterprise event app to coordinate corporate events, and you can read more about this approach in this guide on how an enterprise event app reshapes corporate events for New Zealand offices.
Clarity matters when staff join or move roles, because they need to learn how things actually work, not how they were once described in a static PDF. A well structured flowchart template, supported by consistent flowchart symbols and labelled swimlane diagram lanes, makes it easier to train new colleagues and reduce shadow processes. Over time, you can explore which workflows cause the most delays, then edit each diagram to remove redundant steps and improve collaboration between teams that previously worked in silos.
From ad hoc decisions to governed workflows on digital boards
Many New Zealand companies still rely on ad hoc email chains and informal chats to manage approvals. This approach makes it difficult for an office manager to audit decisions, track data and maintain compliance with internal policies or sector regulations. Moving these activities into an online flowchart maker with shared boards gives you a governed environment where every step is visible and repeatable.
Start by mapping your current approval process as a basic flowchart, then expand it into a swimlane diagram that separates responsibilities for finance, legal and operations. Once the process flow is visible, you can create edit rules for who may change each flowchart template, ensuring that only authorised managers update critical diagrams. For organisations with formal governance requirements, pairing these visual boards with dedicated board management software can be powerful, as explained in this resource on how New Zealand credit unions can modernise governance with board management software.
Governed workflows also make it easier to collaborate with third party suppliers and partners. You can share a free flowchart link that lets external stakeholders view or comment on the diagram without editing rights, which protects your internal standards while still enabling visual collaboration. Over time, your library of templates and diagrams becomes a strategic asset that helps you turn ideas into consistent execution across every team and location.
Using flowcharts to align people, data and systems in New Zealand offices
Office managers often sit at the intersection of people, data and systems, which makes clarity essential. An online flowchart maker helps you map how information moves between tools, so you can identify broken data flow and manual workarounds that waste time. When you draw a flowchart that includes each system touchpoint, you see where third party integrations or simple automation could remove double entry.
For example, a New Zealand professional services firm might use a flowchart generator to model how client enquiries move from website forms into the CRM, then onto project boards and invoicing. By using accurate flowchart symbols and clear steps, the office manager can learn where delays occur, then create edit changes to the process flow that shorten turnaround times. Once the new diagram is agreed, you share the flowchart with the wider team and track whether the updated workflows reduce errors or improve client satisfaction.
These diagrams also support better collaboration between IT, finance and operations when evaluating new tools. A shared online flowchart maker workspace lets each team explore alternative workflows, compare templates and test different swimlane diagram layouts before committing to system changes. Because updates happen in real time, everyone sees the latest version, which reduces confusion and strengthens trust in the documented process.
Planning office changes and site strategies with visual workflows
When a New Zealand company plans an office move or redesign, the office manager often coordinates dozens of moving parts. Using an online flowchart maker, you can turn ideas about seating plans, technology upgrades and change management into structured workflows that everyone understands. A combination of mind maps for brainstorming and detailed flowchart templates for execution helps you move from concept to action without losing important details.
Site selection and office layout decisions benefit from clear diagrams that show dependencies, such as lease negotiations, IT fit out, and third party contractor schedules. You can use a start template focused on relocation projects, then create edit versions for each potential site while you analyse transport links, staff commuting patterns and local amenities. For a deeper view on analytical methods, many office managers refer to guidance on advanced site selection analysis methods in market research for New Zealand offices.
During the change process, visual collaboration becomes critical to maintain staff engagement and reduce anxiety. Sharing a free flowchart that outlines key steps, timelines and responsibilities helps the team learn what to expect and when decisions will be made. Because you can edit the diagram in real time, you keep everyone updated as workflows evolve, which supports transparency and reinforces confidence in leadership.
Practical steps to embed flowchart thinking in your New Zealand office
Adopting an online flowchart maker is not only about the software, it is about changing how your team thinks about processes. Begin with one or two high impact workflows, such as visitor management or expense approvals, and map them as simple flowcharts with clear steps and minimal symbols. Use a free start option if available, then gradually expand into more advanced diagrams as your team grows comfortable.
Encourage staff to explore templates and create their own diagrams for recurring tasks, while you maintain a curated library of official flowchart templates for critical processes. Set guidelines on how to use flowchart symbols, when to update a swimlane diagram and how to document data flow between systems, so that every maker follows the same standards. Regularly review these boards in team meetings, and invite suggestions on where a new flowchart or process flow could remove friction or improve collaboration.
Over time, this practice helps your organisation turn ideas into structured, repeatable workflows that survive staff changes and business growth. Because many online tools offer a free flowchart tier, you can experiment without large upfront costs before committing to paid features. When you consistently share flowcharts, edit diagrams based on feedback and keep templates aligned with reality, you build a culture where clarity and accountability are part of everyday work in your New Zealand office.
Key statistics on visual process management and collaboration
- Research from McKinsey on knowledge workers’ time use indicates that employees can spend a significant share of their week searching for internal information, and clear process diagrams may help reduce this wasted effort by centralising knowledge in visual workflows.
- A survey by the Project Management Institute (PMI) on organisational project performance reports that organisations with mature process management practices are more likely to meet project goals, highlighting the value of structured flowcharts and defined steps for office managers.
- Analysis from Gartner on digital workplace tools indicates that companies using real time collaboration platforms often experience faster decision cycles, which aligns with the benefits of online flowchart maker environments that support shared editing.
- Studies on hybrid work by Microsoft, including its Work Trend Index, show that employees with clear role expectations and documented workflows tend to report higher engagement scores, underlining the importance of accessible flowchart templates and diagrams.
FAQ about using an online flowchart maker in New Zealand offices
How should a New Zealand office manager choose an online flowchart maker ?
Focus on tools that offer real time collaboration, secure New Zealand or Australian data hosting options, and integration with your existing third party platforms such as Microsoft 365 or Google Workspace. Check whether the platform provides free flowchart tiers, reusable templates and swimlane diagram support. Finally, ensure that non technical staff can easily create, edit and share flowcharts without extensive training.
What processes are best suited to flowchart templates in an office environment ?
Start with recurring workflows that involve multiple teams, such as onboarding, procurement, incident reporting and visitor management. These processes benefit from clear steps, defined responsibilities and visible data flow between systems. Once those are stable, expand your flowchart templates to cover project intake, meeting cadences and escalation paths.
How can flowcharts improve collaboration with third party suppliers ?
By sharing a read only or comment only diagram, you can align expectations with contractors, IT providers and facilities partners without exposing internal systems. A shared online flowchart maker workspace lets everyone see the same process flow, deadlines and decision points. This transparency reduces misunderstandings and helps third party teams integrate smoothly into your workflows.
Are free online flowchart tools sufficient for larger New Zealand companies ?
Free tiers are usually suitable for piloting and for small teams, especially when you only need a few diagrams and basic templates. Larger organisations often outgrow these limits and require advanced features such as single sign on, audit logs and granular permissions. In those cases, moving from a free start plan to an enterprise subscription provides the governance and security that office managers need.
How do flowcharts relate to organizational charts and mind maps ?
Flowcharts focus on the sequence of steps in a process, while organizational charts show reporting lines and mind maps capture ideas in a non linear structure. Many online flowchart maker platforms combine these diagram types, allowing office managers to turn ideas from mind maps into structured workflows and align them with existing organisational structures. Using all three views together gives a more complete picture of how work actually happens in your New Zealand company.